Light is very
important for human vision. To deal with the limitation of eyes to see in the
dark, artificial light is invented. The
lighting improves our physiological performance of vision to detect, perceive
and distinguish the existence, size, shape, colour, texture, moving, distance,
changes in the brightness or colours, etc. of the objects to be seen. Consequently,
the efficiency of the human activities will be increased with the improvement
of visual performance.(NARISADA & SCHREUDER, 2004)
What if there is too
much lighting than we need?
Light pollution is an
unwanted consequence of outdoor lighting and includes such effects as sky glow,
light trespass, and glare. (What is light pollution?, 2007)

Figure
1 Useful light vs. light pollution
Source:
(What is light pollution?,
2007)
Sky glow:
Sky glow is the result
of light that is projected upwards, and then scattered and scattered backby
aerosols in the atmosphere to the surface of the Earth. colouring the night sky
and reducing the visibility ofastronomical objects.(Mizon, 2002)
Part of the stray light
is projected directly upwards due to poorly designed lighting or the light is
aimed upwards on purpose. Another major contribution to the stray light is the light
that is well-directed to objects, but reflected by them. For example, road
surfaces, grass, and buildings reflect a fair amount of the incident light, and
the reflected light usually goes upwards.(NARISADA & SCHREUDER, 2004)

Figure
2 Sky glow in Kuala Lumpur, Malaysia
Source:
(Morris, 2011)
Light trespass:
Light trespass occurs when spill light is
cast where it is not wanted. Light trespass is somewhat subjective because it
is difficult to define when, where, and how much light is unwanted. An example
of light trespass is when spill light from a streetlight or floodlight enters a
window and illuminates an indoor area.(What is light
pollution?, 2007)
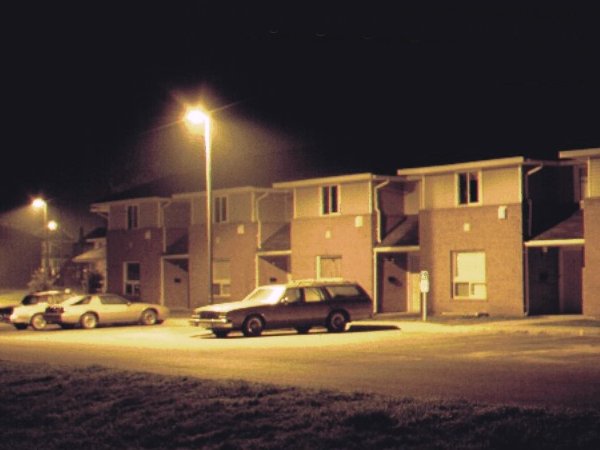
Figure
3 Light trespass
Source:
(LIGHT POLLUTION)

Figure
4 Spill light illuminates the bedroom through window
Source:
(The City Dark, 2011)
Glare:
Glare is a visual the sensation produced by
luminance within the visual field that is sufficiently greater than the
luminance to which the eyes are adapted to. It is subjective, and sensitivity
to glare can vary widely. Older people are usually more sensitive to glare due
to the aging characteristics of the eye. Disability glare is the reduction in
visibility caused by intense light sources in the field of view, while
discomfort glare is the sensation of annoyance or even pain induced by overly
bright sources. (What is light pollution?,
2007)

Figure
5 Glare
Source:
(Rensselaer
Polytechnic Institute, 2007)
Effects of light pollution:
Health:
Light pollution is a form of annoyance.
According to the World Health Organization, annoyance is described as a feeling
of displeasure associated with any agent or condition believed to affect
adversely an individual or a group". Annoyance can lead to stress. It
depends on the stress level whether the health will be influenced.(NARISADA &
SCHREUDER, 2004)
Light pollution is also investigated as a
interfering, aggravating factor that suppresses natural melatonin levels in
humans at night. This suppression simply pulls out the stops to cancer cell
growth. The hormone melatonin normally impedes cancer cell growth and can even
cause cancer cell death. (How Light Pollution Affects
Human Health)
Animal:
Studies have shown that many animals, like
insects and birds, suffer from light at night. Insects are attracted by light.
The many insects may attract predators and, in their tum, secondary predators.
"Street lighting is on the one hand favorable for predators. Lighting may,
however, cause unnatural death"(NARISADA &
SCHREUDER, 2004)
Bright lights nearby the beach discourage
females from coming ashore to nest. But more important, hatchlings can become
disoriented by manmade lighting and fail to find their way quickly to the relative
safety of the open sea. The newly hatched sea turtles developed instincts to
frenetically crawl toward the lightest horizon, because the ocean breakers
would reflect starlight. In the past 100 years, the lighting situation has
changed dramatically. Instead of heading directly into the sea, hatchlings go
toward the brighter light. Those that wander in circles on the sand have a much
higher risk of dying of dehydration, exhaustion or predation. (Hutchinson)


Figure
6 Newly hatched sea turtles wander on the beach
Source:
(Hutchinson)
Energy usage, air pollution:
Artificial lighting consumes electricity.
We need to burn fossil fuel for the production of electricity, and the
by-product of electricity is pollutants. The pollutants include greenhouse
gases and toxic chemical that leads to environmental problems such as global
warming and they threaten human health. Why do we need to spend money on excess
lighting to bring harm to the environment and ourselves?
Safety:
Light can cause confusion or visual
distraction that threatens road safety. High levels of glare can also decrease
visibility for the road user and increase the risk of road accident.Some of the
households over lit their homes to be “safer”. However, overly bright lighting
creates a sharp contrast between light and darkness, making the places outside
the area of illumination nearly invisible. Bad lighting can even attract
criminals by creating deep shadows that offer concealment. (Design Out Crime, 2010)

Figure
7 Security lighting which creates deep
contrast. Can you spot the person in the left picture?
Source:
(Smit)
Colourful lighting may create beautiful
night view. What about the plumes emit from chimney during energy production?

Figure
8 Emission from energy production
Works Cited
Design Out Crime. (2010, December). Retrieved September 20, 2014, from
International Dark-Sky Association:
http://www.darksky.org/assets/documents/ida_safety_brochure-bw.pdf
How
Light Pollution Affects Human Health. (n.d.). Retrieved September 20, 2014, from
Department of Physics, Florida Atlantic University:
http://physics.fau.edu/observatory/lightpol-health.html
Hutchinson,
L. I. (n.d.). TURNING NIGHT INTO DAY: LIGHT POLLUTION’S IMPACTS ON WILDLIFE.
Retrieved September 20, 2014, from Lighting.com:
http://lighting.com/light-pollution-wildlife/
Jones, B.
(2014, March 13). Energy, Climate Change and Security in the Context of
Ukraine: A Discussion with Danish Foreign Minister Martin Lidegaard.
Retrieved September 20, 2014, from BROOKINGS:
http://www.brookings.edu/blogs/planetpolicy/posts/2014/05/13-lidegaard-europe-energy-ukraine
LIGHT
POLLUTION. (n.d.).
Retrieved September 20, 2014, from Starlight Theatre:
http://www.starlight-theatre.ca/LT-POLLUTION.HTM
Mizon, B.
(2002). Light pollution: responses and remedies. London: Springer.
Morris, E.
(2011, February 21). Light Pollution in the World. Retrieved September
20, 2014, from Light Pollution and Dark Skies:
http://lightpollutionanddarkskies.blogspot.sg/
NARISADA ,
K., & SCHREUDER, D. (2004). LIGHT POLLUTION HANDBOOK. Netherlands:
Springer.
Rensselaer
Polytechnic Institute. (2007, February). What is glare? Retrieved
September 27, 2014, from Lighting Research Center:
http://www.lrc.rpi.edu/programs/nlpip/lightinganswers/lightpollution/glare.asp
Smit, J.
(n.d.). Light Pollution—the dark side of light. Retrieved September 20,
2014, from PRETORIA CENTRE OF THE ASTRONOMICAL SOCIETY OF SOUTHERN AFRICA:
http://www.pretoria-astronomy.co.za/light_pollution.htm
The City
Dark. (2011, August 17).
Retrieved September 20, 2014, from Urban Omnibus:
http://urbanomnibus.net/2011/08/the-city-dark/
The
Woman’s Guide to Buying Flattering Eyewear: When should I Buy New Glasses? (2014, February 13). Retrieved September
20, 2014, from Avoce Eyewear Blog: http://avoceeyewear.com/wp/?p=375
What is
light pollution? (2007,
February). Retrieved September 20, 2014, from Lighting Research Center:
http://www.lrc.rpi.edu/programs/nlpip/lightinganswers/lightpollution/lightPollution.asp


